
Python Projects
Density plot using Python
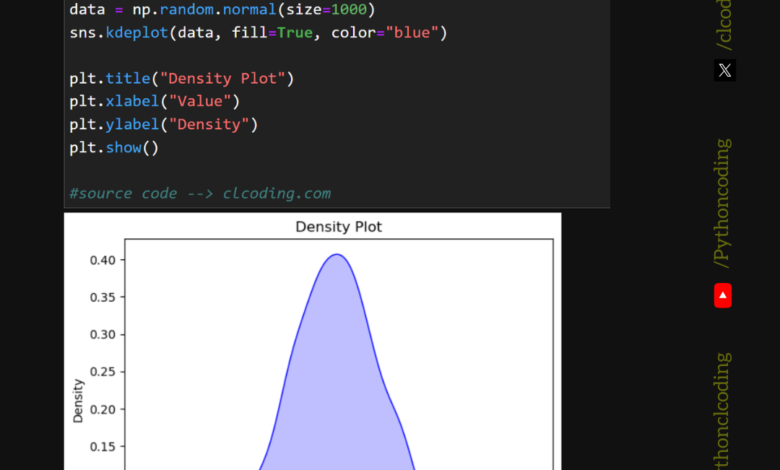
import seaborn as sns
import matplotlib.pyplot as plt
import numpy as np
data = np.random.normal(size=1000)
sns.kdeplot(data, fill=True, color=”blue”)
plt.title(“Density Plot”)
plt.xlabel(“Value”)
plt.ylabel(“Density”)
plt.show()